The Landscape
The Shape of the Early Estuaries
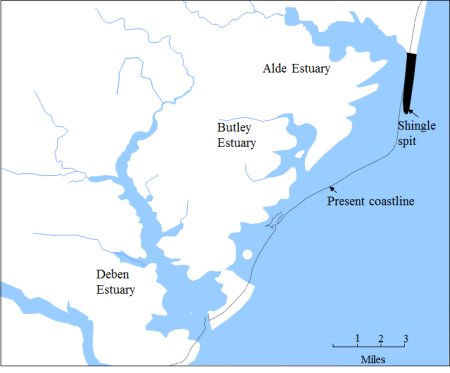
About two thousand years ago, as this map shows, the estuaries of the rivers Deben, Butley and Alde were much wider than today. They had started to form about 3,000 years earlier as the sea level rose and flooded the river valleys.
Two processes transformed these wide estuaries. Firstly, erosion and deposition caused by the tidal flow of the North Sea has caused parts of the coast line to recede by half a mile and the shingle spit, now known as Orford Ness, has become much longer.
Secondly, alluvium carried by the rivers resulted in the growth of extensive salt water marshes (salt marshes) along the edges of the estuaries.
The shape of the coastal estuaries
at high tide 2000 years ago
The Estuaries Today
This map shows the extent of the salt marshes which have built up. Most of these marshes have been reclaimed by building river walls. The marshes in the upper reaches of the Deben estuary were reclaimed in the early 1600s.
The river walls confined the river and thereby eventually deepened it. Larger ships were thus able to reach Woodbridge and this increased the maritime trade.
In some cases the river walls has not been maintained and recovered land has reverted to salt mash.
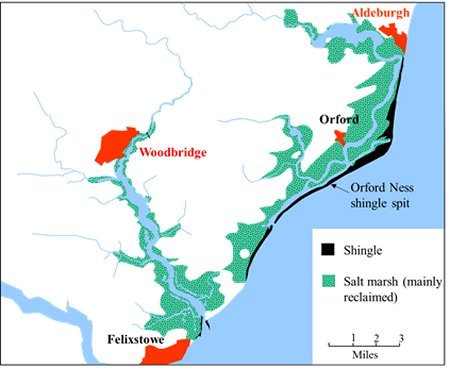
The extent of the salt marshes most of which have been reclaimed by building river walls.
The Side Valleys which Shape Woodbridge
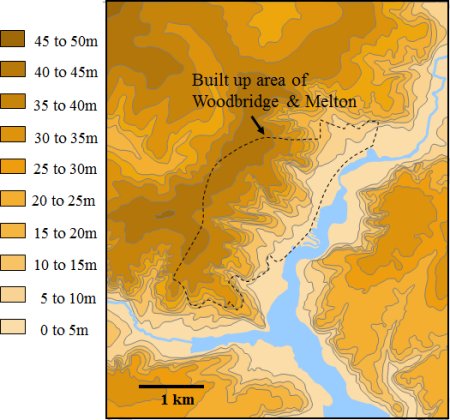
This relief map shows the numerous side valleys which run through Woodbridge and Melton. These valleys are at their most numerous and steepest wherever the streams or brooks which formed them have cut into glacial sands and gravels or into the underlying crag.
Today all the streams and brooks either flow through underground pipes or have been reduced to a trickle. The valleys remain and give Woodbridge and Melton a special character.
Relief map showing the numerous side valleys
across which Woodbridge has been built.
The dotted line shows the extent of the
built up area of Woodbridge and Melton
Last edited 15 Sept 21