Other Sources of Employment and the Growth of the Town
The Expansion of the Built-up Area of the Town up to 1925
Although the population of the town barely changed during the period 1861 to 1925 the built-up area expanded. Most of new housing was taken up by those who had being sharing older properties in the centre of the town. The extent of this expansion will be shown by using the 1838 tithe map.
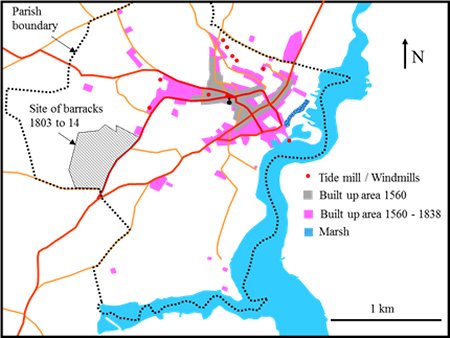
The description of the how the built-up area changed starts with the map on the left. It shows the extent of the built-up area in 1838. The parts shaded grey were developed by 1560 and those shaded purple were developed between 1560 and 1838.
Map of the town in 1838. The area developed
by 1560 is shaded grey and the areas developed
between 1560 and 1838 are shaded purple
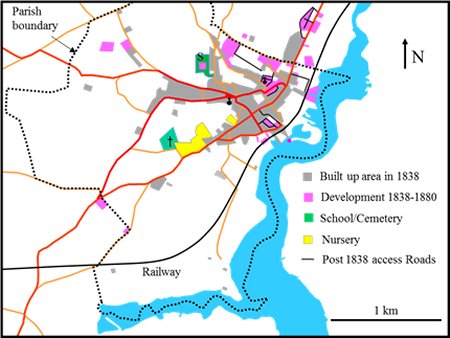
From 1838 to 1880 the built-up areas of the town expanded into the parts shaded purple on the map to the left. The thin black lines are the access roads for the new developments.
The expansion started in 1846 with the building of St John’s Church and the laying out of the streets around it.
The parts of the map shaded yellow were Notcutt’s nursery. Those shaded green were a new cemetery and the grounds of the relocated and expanded Woodbridge Grammar School.
Map of the town in 1880. The area developed
between 1838 and 1880 are shaded purple.
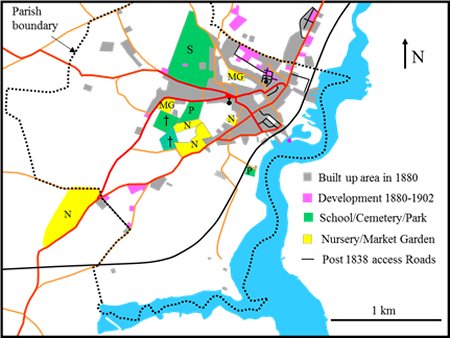
From 1880 to 1902 houses were erected in the parts shaded purple on the map to the left. Most of these houses were near areas which had been developed from 1838 to 1880. The nursery and the grounds of the Woodbridge Grammar School had expanded and two market gardens had been established in the town. A public park (Fen Meadow) had been created in the centre of the town and there was a smaller one by the riverside.
Map of the town in 1902. The area developed
between 1880 and 1902 are shaded purple.
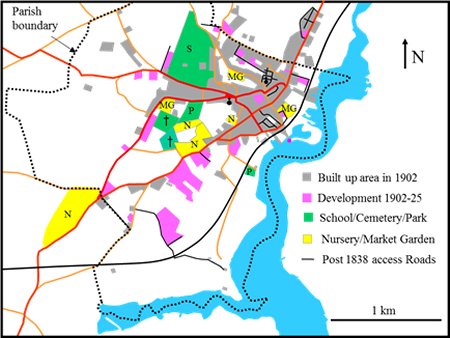
The houses built between 1902 and 1925 were scattered across the town. These new developments are shaded purple on the map to the left. Most of these houses were larger than the ones built over the previous 64 years. The local newspaper reported that the new houses were built to satisfy “the great demand for good houses for the middle class”.
Much of the land abutting the built-up area was being used by the 4 farms surrounding the town and so the inhabitants of the town in 1925 would have still felt they were part of an agricultural area.
Map of the town in 1925. The area developed
between 1902 and 1925 are shaded purple.
.