Retailing
In April 1896 the Urban Council of Woodbridge bought the market rights and it decided to offer yearly leases of the market. Over the next thirty years the market became less popular and the rents received in return for the leases diminished. By 1925 the cattle market was only being held every other week. There is no evidence of the market having been held during the early 1930’s and, in 1936, the council designated the upper part of the Market Hill as a parking space.
Market trading lapsed until 1960 when the Town Council was asked by a trader to give permission to sell fruit and vegetables on the Market Hill every Thursday. For many years the revived market was a thriving concern with standings being available for up to about 15 traders, but by 2002 the number of traders had fallen to 5 and they lobbied to Town Council to allow them to move down to the Turban Centre. The last market on Market Hill was held on 9 May 2002.
The 1560 Extent of Woodbridge late Priory mentions four shops in the town but, as the document was a compilation of several sources, the data it contains on commerce is unlikely to be comprehensive. One of the shops mentioned was on Market Hill and three others and a tavern were around the junction of Church Street and The Thoroughfare. There were also two bake houses. At that time some shops would have been little more than craftsmen’s workshops. Metalworkers, carpenters, leatherworkers, shoe makers and potters etc would have produced goods for the townspeople and for the country people who came to buy and sell in the market.
In the mid seventeenth century there was a desperate shortage of small denomination coinage. To encourage trade, local shopkeepers minted their own copper coins to give as change. A quarter penny token issued by a Woodbridge Grocer in 1656 is shown here.

A quarter penny token issued by the Woodbridge grocer Henry Stebbing in 1656.
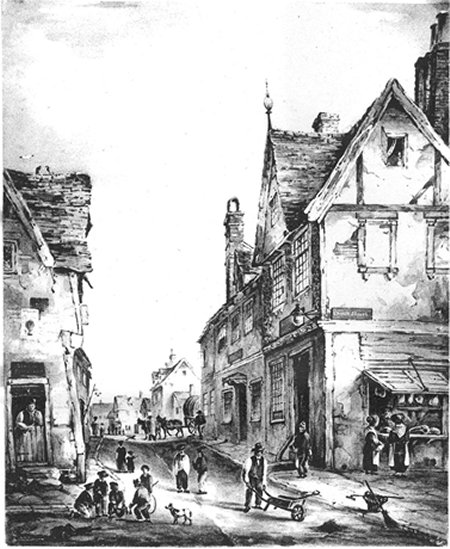
George Rowe’s 1832 painting showing a shop on the corner of Church Street and Cumberland Street.
The only way of estimating the number of shops in Woodbridge during the eighteenth century is to use an Excise survey of 1759. According to this source there were 15,113 shops across Norfolk and Suffolk serving a population of about 512,000. On this basis there were 34 people to every shop and, if this were the case for Woodbridge, there would have been about 60 shops in the town. It is thus not surprising that the lord of the Woodbridge Market was complaining of the loss of trade to shops in 1756.
Many of these shops were likely to be petty shops, small shops which typically sold candles, bread, small beer and a diverse range of small articles to artisans and labourers, but there would also have been bigger shops selling meat, groceries, clothing, draperies and household goods to the more affluent.
The next record of the number of shops in Suffolk was produced in 1789 when a tax was levied on those having an annual rent of greater than £5. The data for some towns, including Woodbridge, has not survived but that for Beccles and Bungay has. Using the data for these two towns, which were comparable in size to Woodbridge, it is estimated that there were 44 shops in Woodbridge having an annual rent of greater than £5. This is somewhat smaller than the 60 estimated using the 1756 data but this number included shops with an annual rent of less £5.
The earliest image of a shop in the town is shown on the left. It is a painting by George Rowe and it shows goods being sold from the open window of a shop at the corner of Church Street and Cumberland Street in 1832. By 1838 this building is listed as a grocer’s shop run by Frederick Mathew.
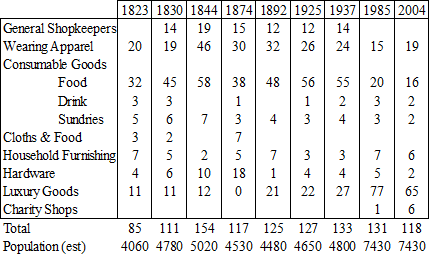
Trade directories from 1823 to 1937 provide a comprehensive picture of the evolution of shops in Woodbridge. The data they contain, and that from two surveys undertaken in 1985 and 2004, is presented in this table. The total number of shops in each year is at the bottom of the table as is the population of the town.
The changes in the number and type of shops reflects changes in the population and prosperity of Woodbridge. To explain them its necessary to look more closely at what happened during three very different periods during evolution of the town.
Analysis of shops in Woodbridge from 1823 based on Trade Directories and surveys